Trends in Physics PhDs
The trend data detailed in this Focus On includes doctorates from the class of 2019. It presents data on the number of physics PhDs awarded in the U.S. including data on citizenship, women, and PhDs from underrepresented groups. It also includes data on educational background, time to degree, subfield of dissertation, and general satisfaction with degree for PhDs from the classes of 2017 and 2018.
During the 2018–19 academic year, the 204 PhD-granting physics departments in the US conferred a total of 1,903 physics PhDs. Although this number is relatively unchanged from the previous year, the number of physics PhDs conferred has risen 75% since a recent low in 2004 (see Figure 1). Even with its sharp fluctuations over the last four decades, the number of physics PhDs conferred annually has consistently represented about 3% of all PhDs awarded in the United States.
Figure 1
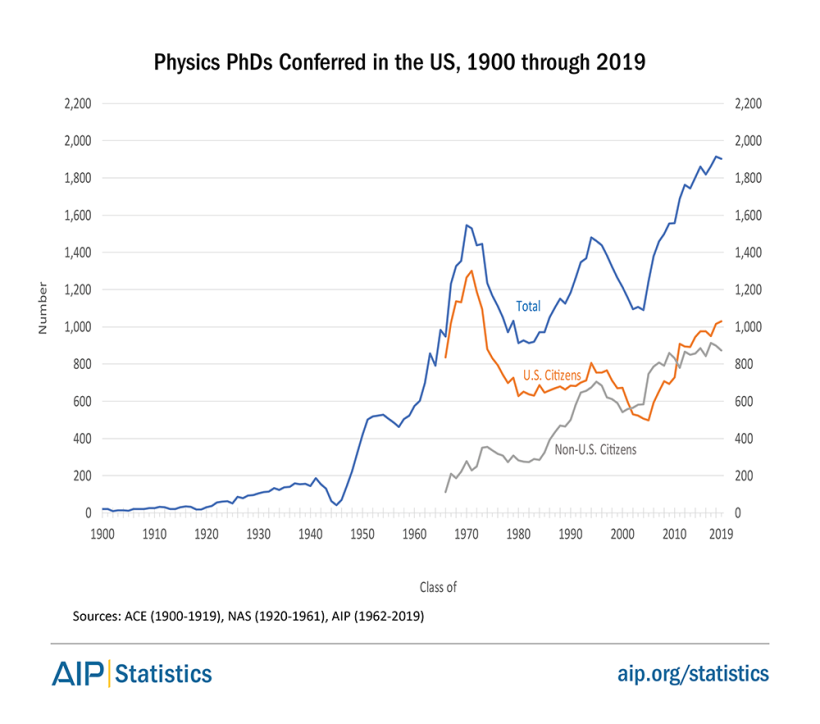
US citizens have comprised the majority of physics PhDs conferred since the class of 2011. The period of 2002 to 2010 was the only time in which US institutions conferred more physics PhDs to non-US citizens than to US citizens (see Figure 1).
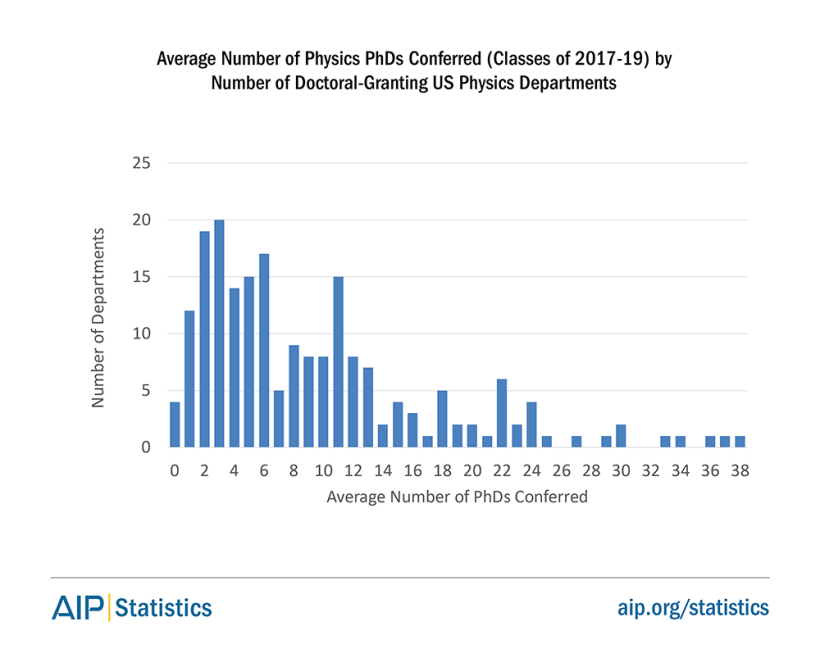
The average number of physics PhDs awarded by departments varies considerably (see Figure 2). Half of the PhD-granting physics departments awarded an average of six or fewer PhDs, and about a fifth (42 departments) awarded an average of 14 or more, with five of these departments averaging more than 30 PhDs across three academic years.
A detailed department-by-department listing of degree-granting physics departments with the number of degrees they conferred annually can be found in the Roster of Physics Departments
Figure 2
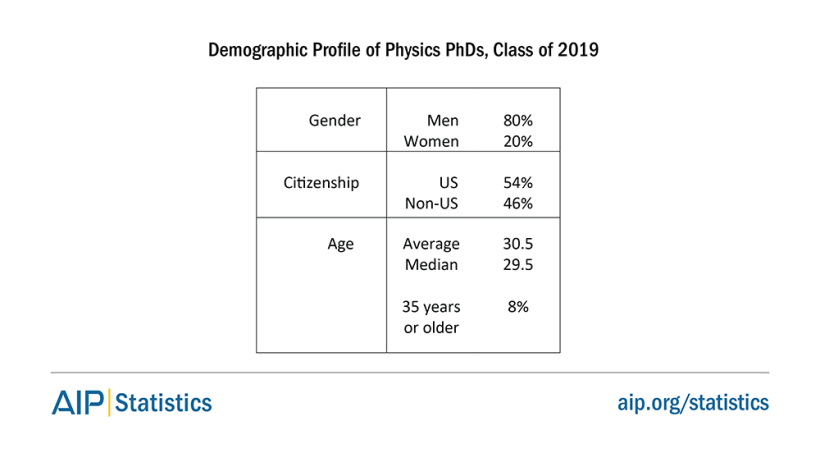
Of physics PhDs conferred in the class of 2019, 54% were awarded to US citizens (see Table 1). The median age of physics PhDs in the classes of 2017 and 2018 combined was 29.5. The median age for all PhDs conferred (regardless of field) in the US in 2018 was 31.4. As a group, doctorate recipients in the earth and physical sciences, which includes physics, had the lowest median age at 29.5 [1].
Table 1
Click image to see larger version
Women represented 19% of the physics PhDs awarded in the class of 2019. Among respondents to the AIP Degree Recipient Follow-up Survey, classes of 2017 and 2018 combined, fewer than 1% reported a gender identity other than man or woman. The representation of women among new physics PhDs recipients has held fairly flat for over a decade and has not changed much since 2008 when the representation of women first reached 19% (see Figure 3). The proportion of non-US citizens among physics PhD recipients who were women is greater than among men. In the class of 2019, non-US citizens represented 53% of the women awarded physics PhDs and 44% of men.
Figure 3

Physics PhDs who are African American/Black and Hispanic/Latino continue to be underrepresented when compared to the overall population of 25–34 year-olds in the US, as well as among all recent PhD recipients (see Table 2) [2]. The identification of race and ethnicity is limited to only physics PhDs who have US citizenship. Of the 204 departments that offered a physics PhD in the 2018–19 academic year, five were located at an Historically Black College and University (HBCU). These five departments conferred about a fifth of the physics PhDs to African Americans in the classes of 2018 and 2019.
Table 2
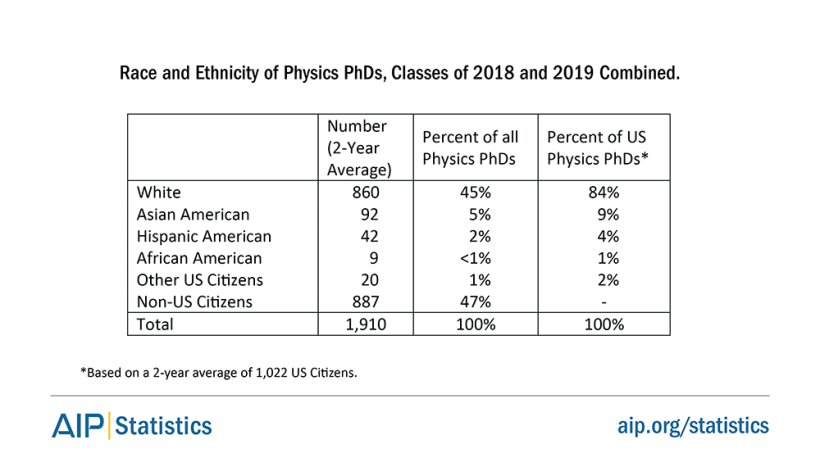
Although still underrepresented, the number and proportion of Hispanic/Latino physics PhDs has increased in recent years. On the other hand, African American/Black physics PhDs continue to be greatly underrepresented in both number and percent of physics PhDs awarded. Furthermore, these numbers have been declining in recent years, with half as many physics PhDs being awarded to African American/Black physics PhDs than in 2012. (see Figure 4).
As seen in Table 1, non-US citizens represented just under half the physics PhDs (46%) conferred in the class of 2019. Students from the countries within Asia, especially China, make up the majority of the international students coming to the US to study physics (Table 3).
Table 3

Background
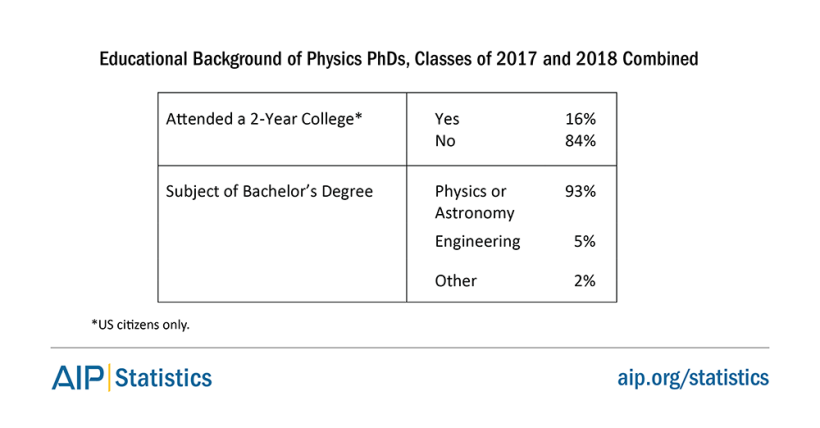
Physics PhDs come from a variety of educational backgrounds, including a diverse set of educational systems outside the US. The majority of physics PhDs indicated their undergraduate degrees were in physics or astronomy (see Table 4). The two-year college system has become an important part of the US education pipeline. Looking just at US citizens, 16% of the physics PhDs in the classes of 2017 and 2018 combined indicated that they started their college education at a two-year or community college. These figures do not include students who took a course at a community college while enrolled in high school and then matriculated directly to a four-year institution after graduation.
Table 4
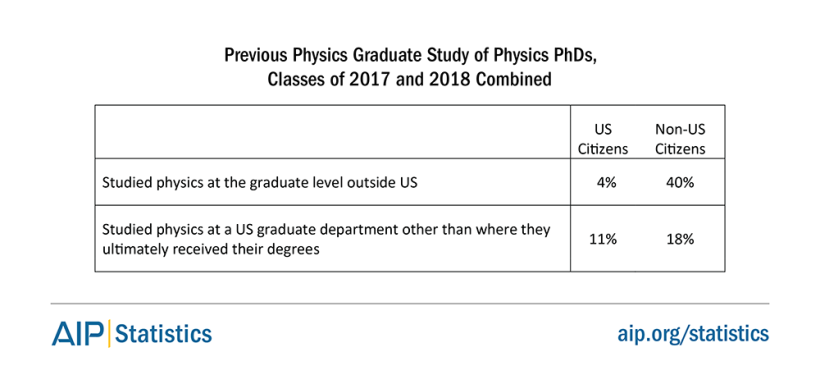
Some PhDs started their physics graduate education at a physics department other than the one at which they ultimately received their PhD. This was especially true for non-US citizens, with 40% indicating they had been enrolled in a graduate physics program prior to coming to the United States to study (see Table 5). Transferring from another US graduate physics program to the department from which they ultimately received their PhD was another educational path for both US citizens and non-citizens. Some of the new physics PhDs who had previously started their physics graduate education at a different institution, whether from abroad or another US institution, may have earned a master’s degree as a result of their prior graduate study.
Table 5
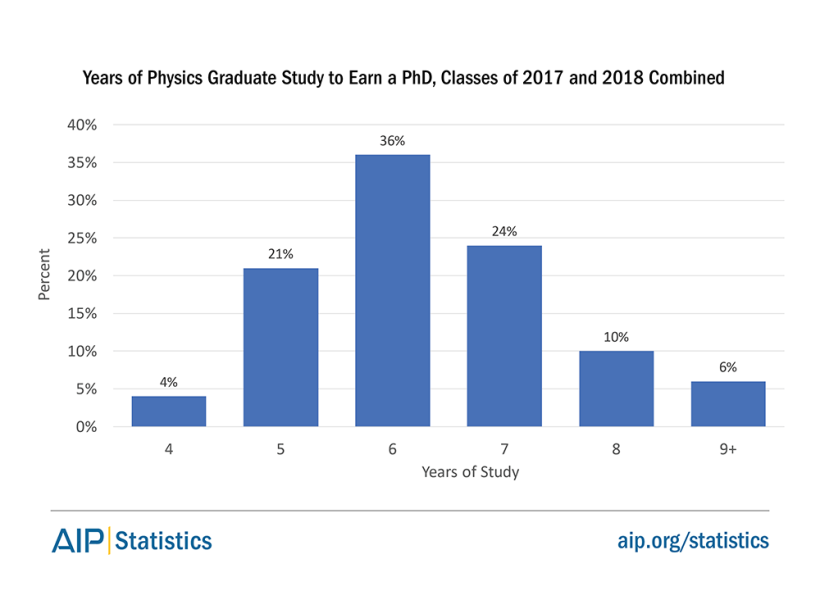
The average length of time to earn a physics PhD in the combined classes of 2017 and 2018 was 6.2 years. For this report, the number of years to earn a PhD is measured by a self-reported full-time equivalent (FTE) number of years registered at a physics department. The data is collected in half-year increments and rounded up to the next full year for display (see Figure 5). Although the median length of time to receive their degrees was 6 years, 16% of new PhDs indicated it took them 8 or more years.
The 40% of the non-US citizen PhD recipients who had been enrolled in a graduate physics program outside the US before coming to study physics in the United States did not report significantly fewer FTE years of physics study in the US than the non-US citizens who studied only in the US.
Figure 5
Condensed matter physics continues to be the most common dissertation subfield of physics PhDs, with an estimated average of 20% of physics PhDs choosing this subfield in the combined classes of 2017 and 2018 (see Figure 6). A greater proportion of non-US citizens (25%) had a subfield of condensed matter than US citizens (15%).
There were a few subfields where the representation by gender differed in a statistically significant way. A larger proportion of men (21%) had a dissertation subfield of condensed matter than women (15%). Women, on the other hand, were more likely to have dissertation subfields of astrophysics (22% vs 13%) and biophysics (12% vs 6%) than men.
More than half (53%) of physics PhDs in the classes of 2017 and 2018 indicated that their dissertation research method was experimental. Most (37%) of the remaining PhDs indicated their dissertation research method was theoretical, with the remaining balance of the PhDs indicating either observational (7%) or other (3%).
The research dissertation method utilized by new physics PhDs in the classes of 2017 and 2018 varied somewhat by their dissertation subfield and the differences are statistically significant. PhDs with dissertation topics of ‘condensed matter,’ ’nuclear physics,’ and ‘atomic, molecular, and optical physics,’ as well as the more applied areas such as ‘materials science,’ ‘optics,’ and ‘engineering physics’ were skewed toward being experimentalists. PhDs with subfields of ‘particles and fields,’ ‘computational physics,’ ‘quantum foundations,’ ‘complex systems,’ and ‘relativity’ tended to have a greater proportion of theoreticians. Many of the astrophysicists indicated their dissertation research method was observational. In general, US citizens were statistically more likely to have a primary dissertation research method that was experimental than were non-US citizens (59% vs. 46%). Over half of physics PhDs indicated that computer simulation or modeling was a major tool in connection with their dissertation work.
Figure 6

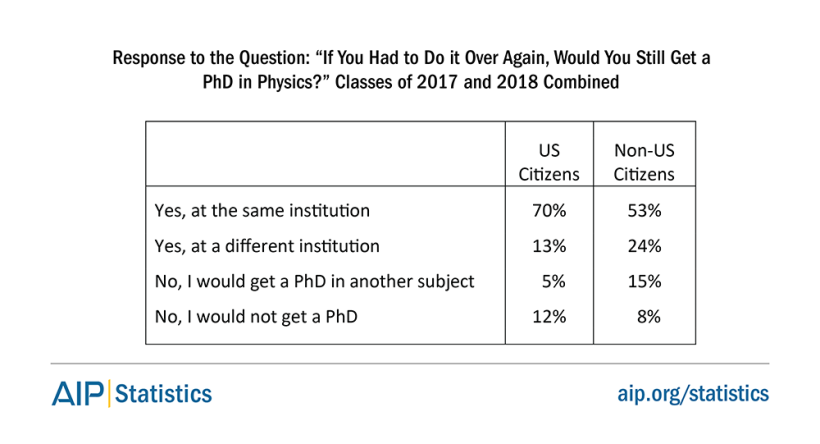
The majority of new physics PhD recipients in the classes of 2017 and 2018 indicated they would still get a physics PhD if they had the opportunity to relive their educational pursuits (see Table 6). There were significant differences between US citizens and non-US citizens when reflecting on their educational choices concerning their pursuit of a physics PhD. The majority (70%) of US citizens indicated they would repeat their physics doctoral education at the same institution from which they received their PhD. Non-US citizens were less content with their choices, with 53% indicating they would get their physics PhD at their degree-granting institution. However, a significantly greater proportion of the non-US citizens than the US citizens indicated they would still pursue a physics PhD but at another institution. A fair number of both US and non-US citizens indicated they would pursue a PhD in another discipline or opt not to get a PhD at all if given the opportunity to “do it over.”
Table 6
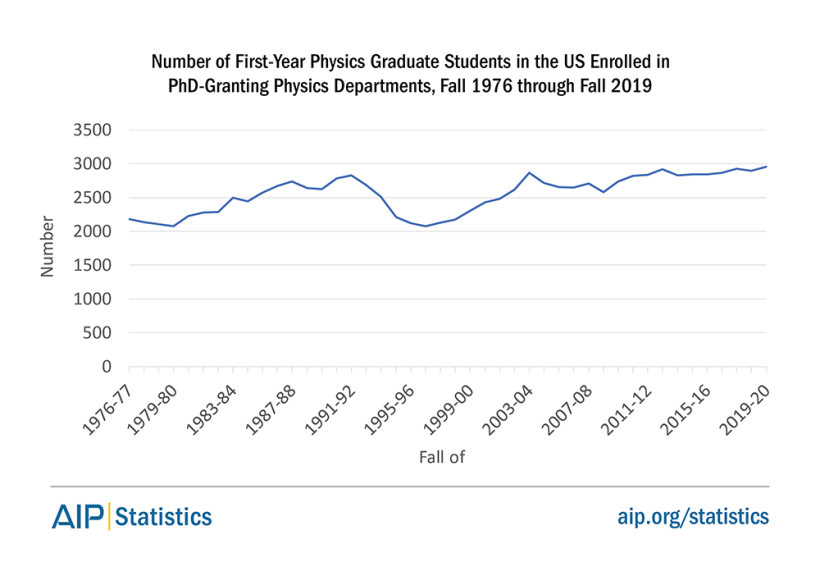
In the fall of the 2019-20 academic year, 2,956 physics graduate students were in their first year of study at the PhD department in which they were enrolled. The increases in the number of first-year students enrolling in graduate physics programs at PhD granting departments has slowed in recent years, with an average annual increase of only about 1% a year for the last decade (see Figure 7). With the recent flattening in the number of students enrolling in PhD graduate physics programs it is anticipated that the number of new PhDs conferred annually in the US will also level off.
Figure 7
References
[1] National Science Foundation, National Center for Science and Engineering Statistics (NCES). Survey of Earned Doctorates, 2018. Table 27
[2] U.S. Census Bureau, Current Population Survey, 2017 Annual Social and Economic Supplement. https://www.census.gov/data/tables/2017/demo/education-attainment/cps-detailed-tables.html
Methodology
Each fall the Statistical Research Center (SRC) conducts its Survey of Enrollments and Degrees. The survey is sent to all degree-granting physics and astronomy departments in the United States and Puerto Rico. Departments are asked to provide information concerning the number of students they currently have enrolled and the number of degrees they conferred in the previous academic year. We define the academic year as being from September to August.
In the 2018–19 academic year, 204 of the 753 physics departments offered a doctorate degree. We received responses from 95% of these departments. The data in this Focus On addressing number of degrees, enrollments, citizenship, gender, and race/ethnicity come from this annual census of physics departments. For nonresponding departments, we estimated numbers and included them in the totals.
In the 2018–19 academic year, there were 45 departments that offered a PhD in astronomy. Thirteen of these departments were administered as part of a combined physics and astronomy department, with the remainder administered as separate astronomy departments. Data concerning astronomy degrees conferred at both the combined and separate departments are collected separately from the physics degrees and are reported separately in other Focus Ons (https://www.aip.org/statistics/astronomy
The annual Enrollments and Degrees survey also asks for the names and contact information for recent PhDs. This degree recipient information is used to conduct our Follow-up Survey in the winter following the academic year in which respondents received their degrees. We received post-degree information directly from 30% of the physics PhDs in the classes of 2018 and 2019. The data in Tables 1-3 and Figures 1-4, and 7 comes from the Enrollments and Degrees survey. The data in Tables 4, 5, and 6, and Figures 5 and 6 comes from the Follow-up Survey.
The PhD Follow-up Survey also collects post-degree outcome data. Employment related data from the Follow-up Survey are published in separate Focus Ons; see https://www.aip.org/statistics/employment/phds
All differences discussed in the text were tested and found to be statistically significant.
This report was possible because of the efforts of department chairs, faculty, and staff members in providing their departmental data to AIP year after year. We also thank the many new physics PhDs that shared their educational and employment experiences with us.
e-Updates
You can sign up to receive email alerts that notify you when we post a new report or resource. Visit https://www.aip.org/statistics/stats_subscribe
Follow Us on Twitter
The Statistical Research Center is your source for data on education, careers, and diversity in physics, astronomy, and other physical sciences. Follow us at @AIP_Stats.
Trends in Physics PhDs
By Patrick J. Mulvey, Starr Nicholson, and Jack Pold
Published: February 2021
A product of the Statistical Research Center of the American Institute of Physics
1 Physics Ellipse, College Park, MD 20740
stats [at] aip.org | 301.209.3070 | aip.org/statistics


